Lund University’s climate impact
In 2021, the University conducted an analysis of its climate impact that provides a holistic picture of the University’s climate-impacting emissions during 2018 and 2020. The areas that account for most emissions are research equipment and goods, travel and premises. Between 2018 and 2020, emissions dropped by around 25%, which was largely attributable solely to the reduction in travel during the Covid-19 pandemic.
The goal of the University’s sustainability plan is a 50% reduction of greenhouse gas emissions by 2023 (reference year 2018). The University also adheres to the Climate Framework, which requires measures to have been taken by 2030 in order to be in line with the 1.5 degree target.
Climate footprint calculation will be used as a basis for necessary interventions to achieve the targets of a marked reduction in climate impact. Process managers in the areas with the highest impact are to propose measures (procurement, travel/transport and premises) and LU Finance has been tasked with revising the University’s travel regulations.
Environmental Spend Analysis report for Lund University (PDF 1.36 MB, new tab, in Swedish)
Comparison of the climate impact 2018 and 2020 (tonne CO2e)
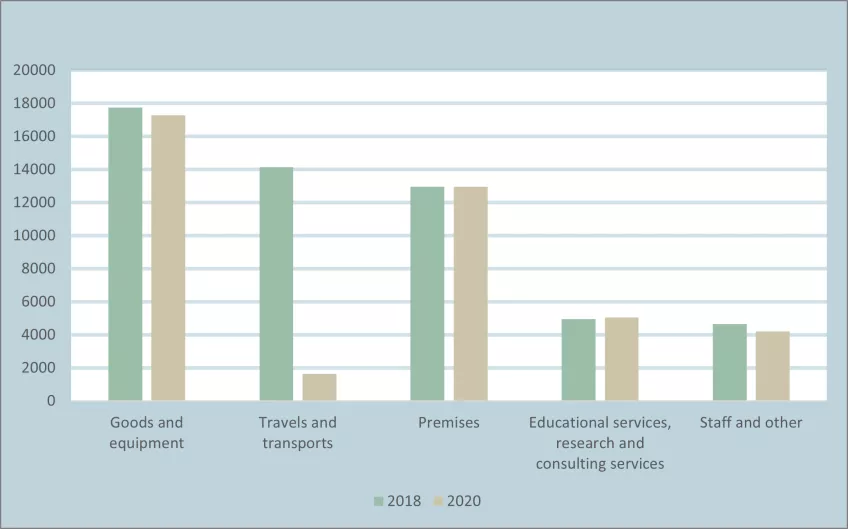
The total climate impact of Lund University in 2018 amounted to approximately 54 000 tonnes CO2 equivalents, and in 2020 41 000 tonnes CO2 equivalents. The difference is largely caused by decreased emissions within the category Travels and transports - an effect of the Covid-19 pandemic.
Two years were selected to calculate the climate-impacting emissions: 2018 was chosen because it constitutes a base year for Lund University’s greenhouse gas emissions reduction target and 2020 was selected to provide a picture of the extent to which the University’s carbon dioxide emissions were affected by the Covid-19 pandemic.
Business travel
- In 2021, 2083 flight tickets and 2535 train tickets were purchased at Lund University.
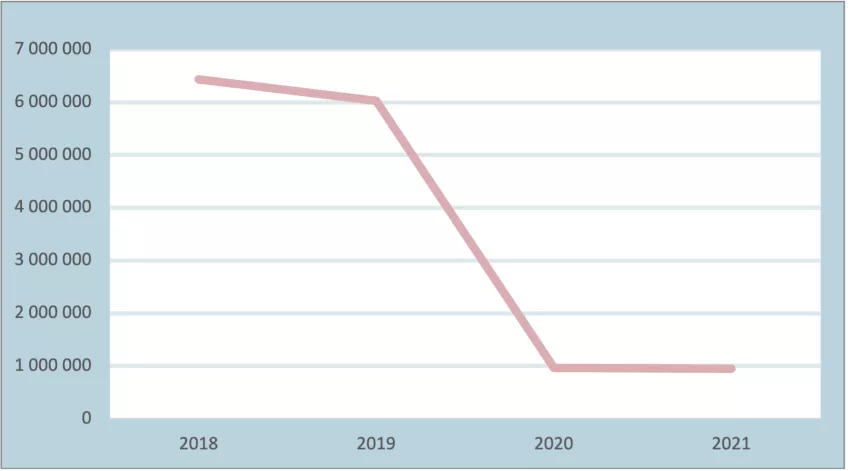
- Carbon dioxide emissions from travel dropped by 1% compared with 2020 and by 84% compared with 2019 before the pandemic. Air travel accounts for the greatest reduction.
Emissions from all business travel 2018–2021 (kg CO2)
Emissions from business travel divided between air travel and other means of transport (kg CO2)
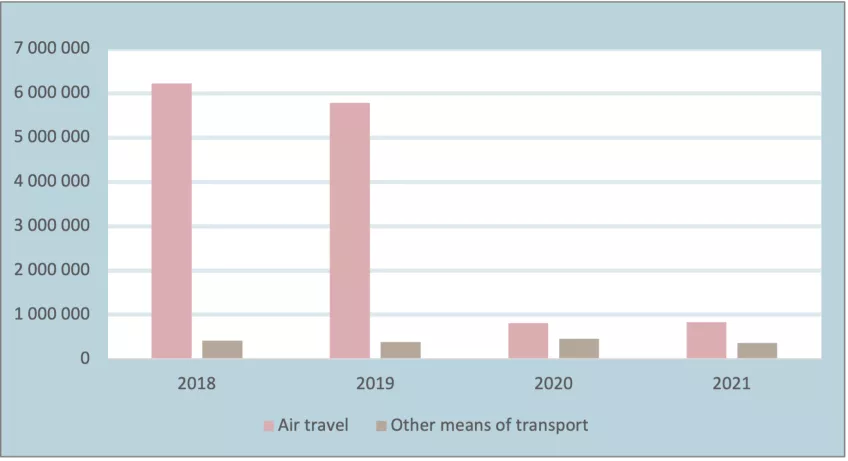
Detailed statistics on emissions from various means of transport
| Means of transport | 2019 | 2020 | 2021 |
|---|---|---|---|
| Air travel under 500 km | 45 651 | 6 391 | 39 365 |
| Air travel over 500 km | 5 743 954 | 804 154 | 787 813 |
| Car | 213 469 | 139 746 | 108 942 |
| Train | 22 | 8 | 8 |
| Bus or coach | 24 622 | 10 688 | 13 163 |
| Total business travel | 6 027 718 | 960 987 | 949 291 |
| Aviation training | 143 615 | 305 852 | 241 454 |
The School of Aviation uses flights for training purposes, which are not included in the diagram of business travel above. Emissions from short flights increased in 2021 compared with 2020. This is mainly due to new calculation factors which ascribe higher emissions to short flights. In total, the long flights account for significantly more emissions.
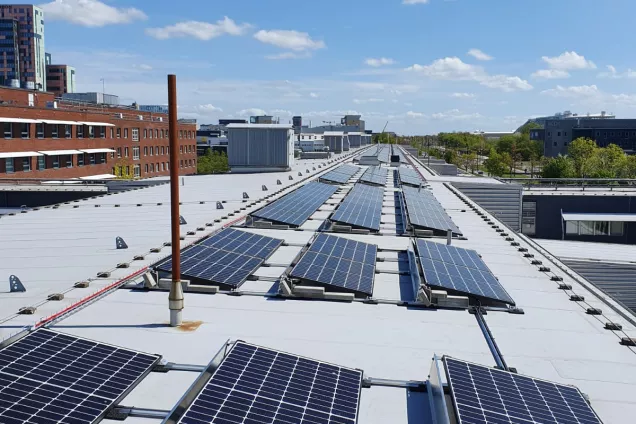
Investment in solar cells
In 2021, Akademiska Hus made a huge investment in renewable energy at Lund University, with 9 new solar cell facilities. Read more about them on the Akademiska Hus website.
Goods and equipment affect the environment the most
Interview with environmental manager Claes Nilén and environmental coordinator Marianne Dalbro.
Annual environmental report
At the beginning of every year, the University submits a report on its environmental management work to the Government and to the Swedish Environmental Protection Agency. In the report, you can read about the University’s efforts over the past year to achieve the environmental goals in the sustainability plan.
Lund University’s environmental report 2021, in Swedish (PDF 270 kB, new tab)